La Météo de Discover par 1492.Vision - EN
Indice de volatilité Google Discover - EN
Updated on 2026-06-15 04:04:04. EN
Une météo Discover ?
Google Discover peut représenter plus de 70% du trafic d'un media, pourtant aucune mesure de volatilité n'était disponible jusqu'à présent.
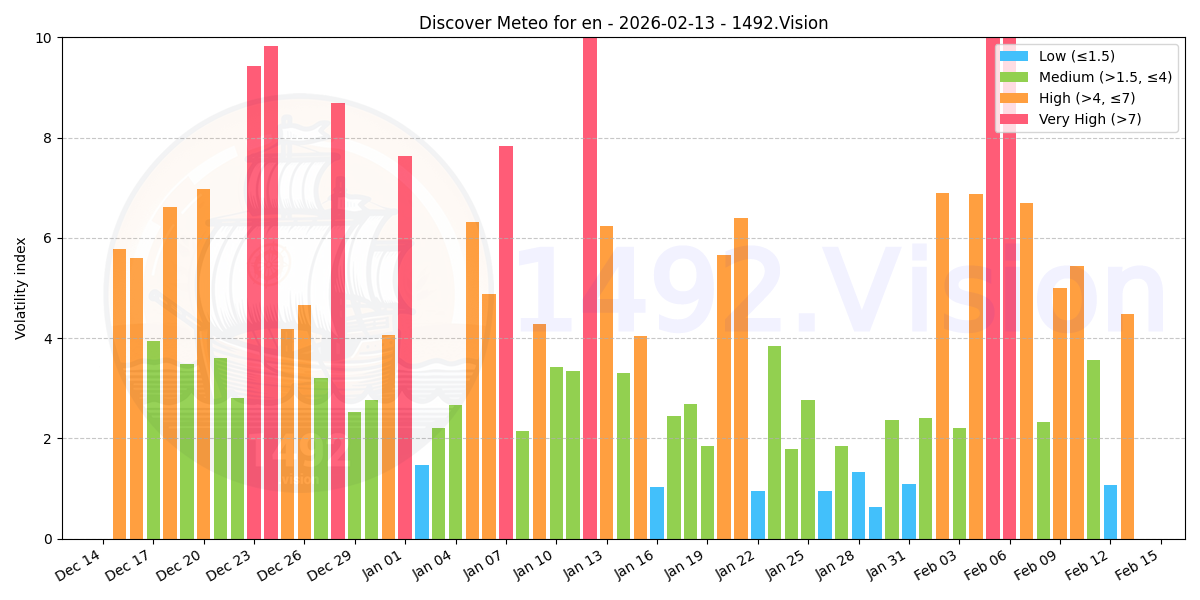
A partir de son index d'articles, 1492.Vision a pu calculer un index de volatilité global, donnant une vue d'ensemble des variations de la plateforme.
Cet indicateur est essentiel pour savoir si les variations qu'un éditeur peut constater sont liées à un problème propre à son site, ou à des changements algorithmiques.
Comment c'est calcule ?
Nous calculons la variation, jour après jour, de plusieurs sous-indicateurs. Cela prend en compte les domaines représentés, mais aussi les catégories, les entités, types de carte etc...
L'indicateur visible ici est une aggregation de ces sous-indicateurs sur les 60 derniers jours. Il est mis à jour chaque nuit.
Nous avons detaillé notre démarche complète dans un article sur Reacteur.com
Plus pour les clients
Les clients de 1492.Vision ont acces a des indicateurs plus detaillés: L'ensemble des sous-indicateurs jour par jour, mais aussi la repartition topic par topic.
Nous testons aussi des annotations de différents types, pour avoir les bons repères.
Et bien sur, l'accès à nos dashboards pour suivre et analyser vos performances et celles des concurrents !
Cette météo sur votre site
Vous pouvez utiliser l'image ci-dessus pour afficher la météo Discover sur votre site, aux conditions suivantes:
- Pas de modification de l'image
- Mention de la source avec un lien vers cette page
https://1492.vision/img/meteo/meteo_fr.png
Notre substack pour rester informé: Substack 1492.Vision